12 Factors
In R, factors are a class of data that allow for ordered categories with a fixed set of acceptable values.
Typically, you would convert a column from character or numeric class to a factor if you want to set an intrinsic order to the values (“levels”) so they can be displayed non-alphabetically in plots and tables, or for use in linear model analyses (more on this later).
Working with factors is easy with the forcats package:
12.0.1 Applying changes across columns
Using across - we can apply functions to columns based on selected criteria - here within mutate we are changing each column in the .cols argument and applying the function forcats::as_factor()
Rows: 344
Columns: 5
$ species <fct> Adelie Penguin (Pygoscelis adeliae), Adelie Penguin (Pygosceli…
$ region  <fct> Anvers, Anvers, Anvers, Anvers, Anvers, Anvers, Anvers, Anvers…
$ island  <fct> Torgersen, Torgersen, Torgersen, Torgersen, Torgersen, Torgers…
$ stage   <fct> "Adult, 1 Egg Stage", "Adult, 1 Egg Stage", "Adult, 1 Egg Stag…
$ sex <fct> MALE, FEMALE, FEMALE, NA, FEMALE, MALE, FEMALE, MALE, NA, NA, …Unless we assign the output of this code to an R object it will just print into the console, in the above I am demonstrating how to change variables to factors but we aren’t “saving” this change.
12.0.2 Ordering factors manually
With the forcats::fct_relevel function we can set factors and apply a specified level at the same time:
12.0.3 Ordering factors by another variable
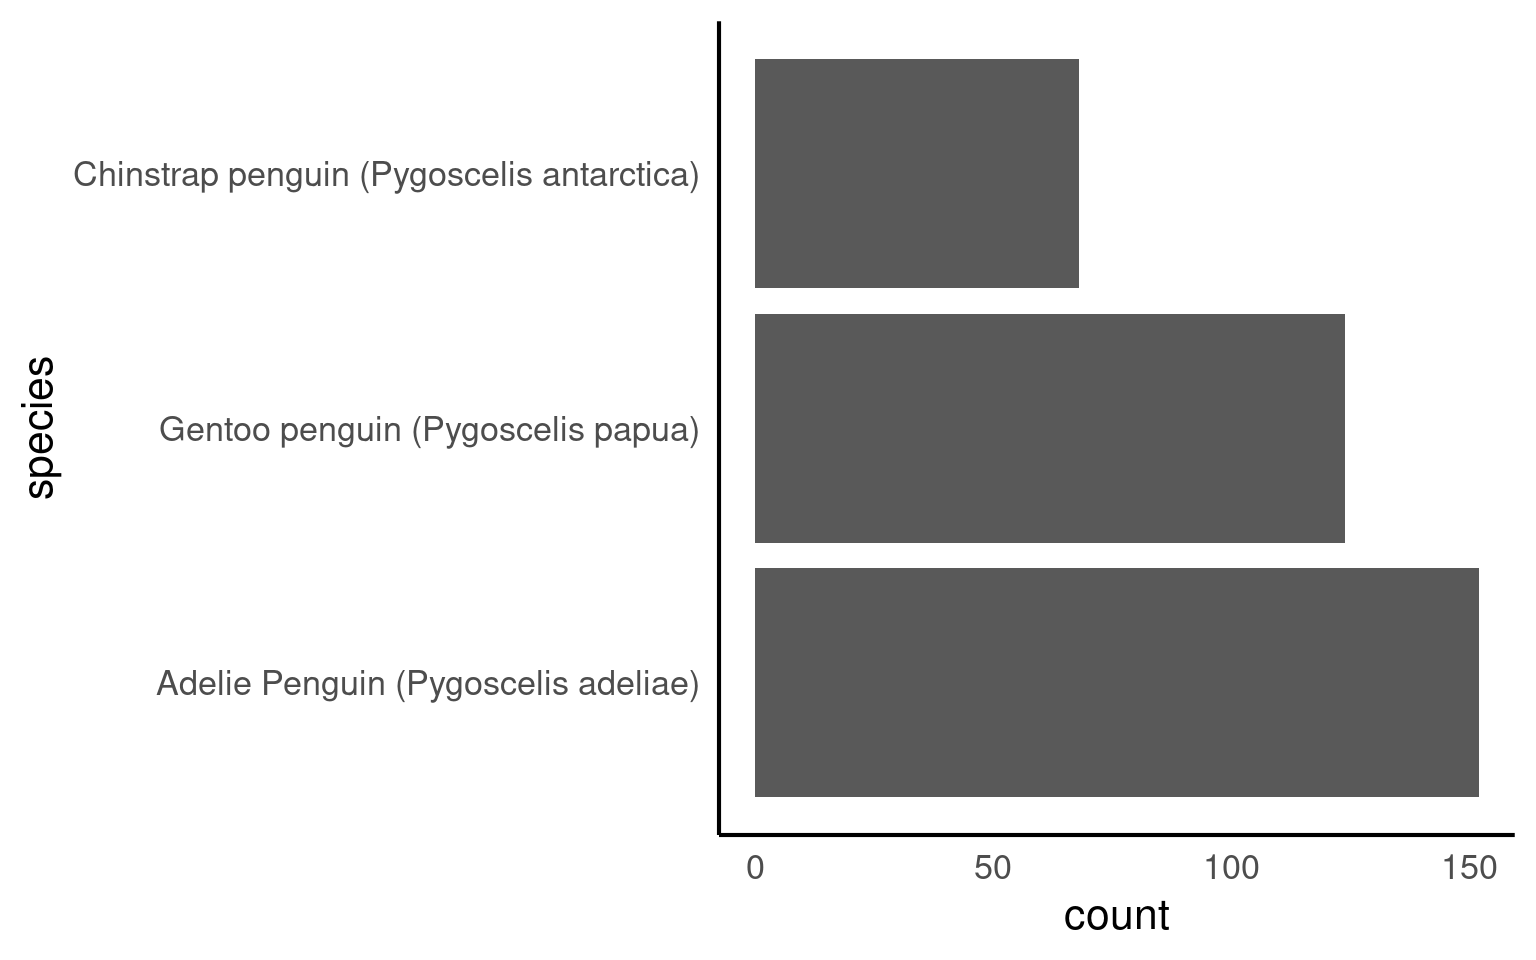
With the function forcats::fct_infreq we can change the order according to how frequently each level occurs
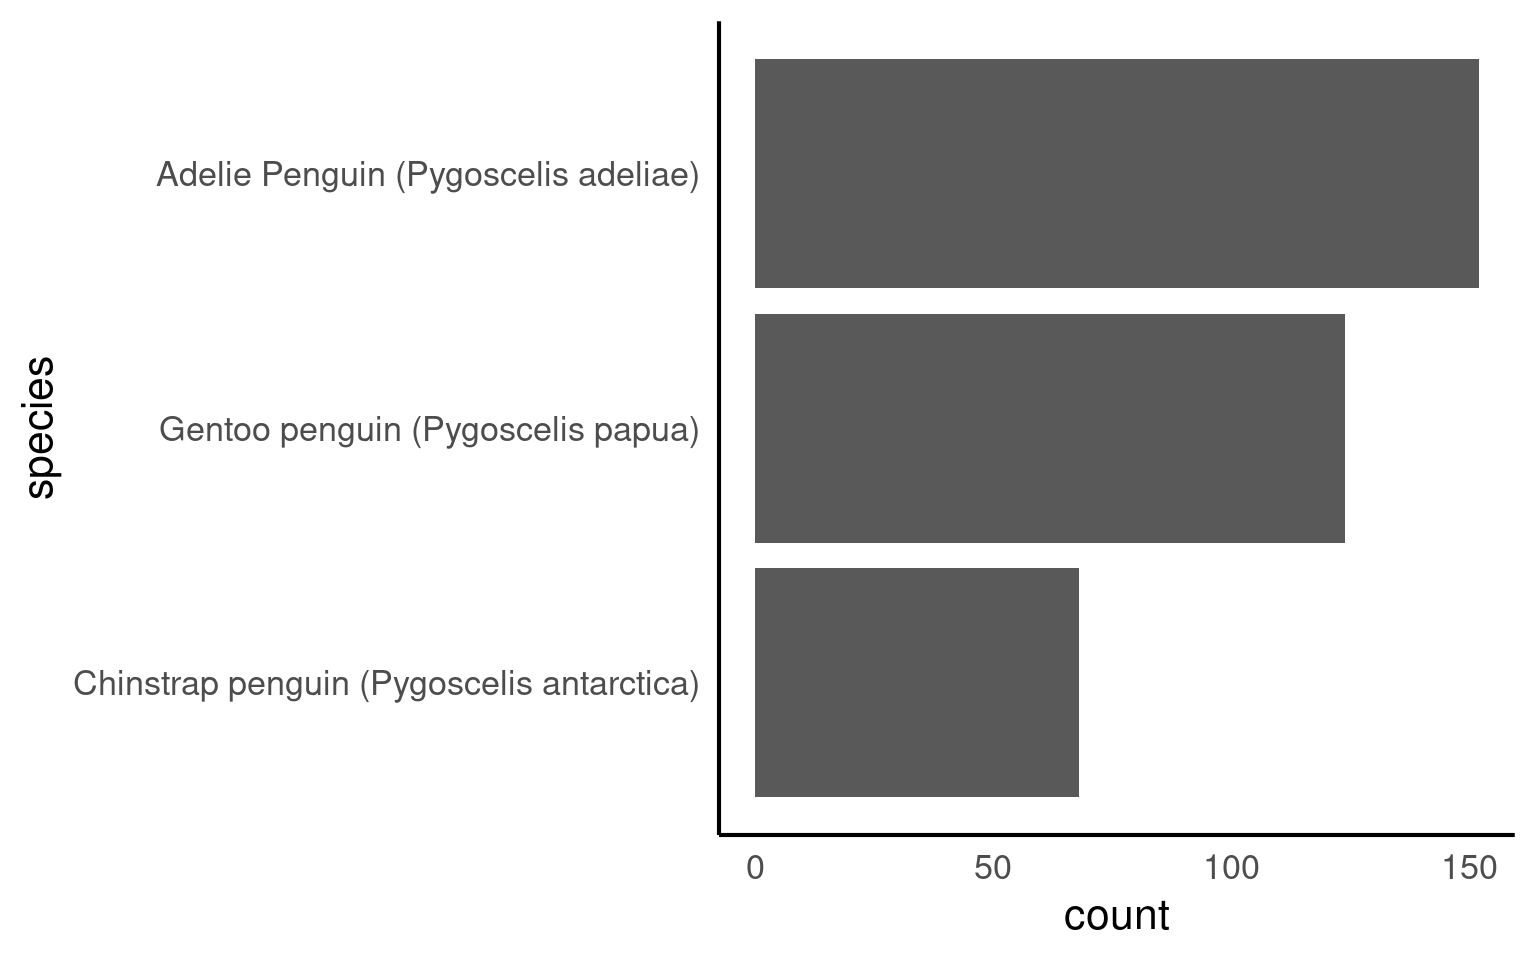
The forcats::fct_rev() function in R is used to reverse the order of levels in a factor variable. It is particularly useful for changing the order of factor levels when you want to display data in a reversed or descending order.
penguins_clean_names |>
  mutate(species = as_factor(species) |>
           fct_reorder(body_mass_g,
                       .fun = mean,
                       .na_rm = T)) |>
  # by default the levels are ordered by the median values of the continuous variable
  # mean, min and max can all be included here
  ggplot(aes(x = species,
             y = body_mass_g,
             colour = species))+
  geom_boxplot(width = .2,
               outlier.shape = NA)+
  coord_flip()+
  theme(legend.position ="none")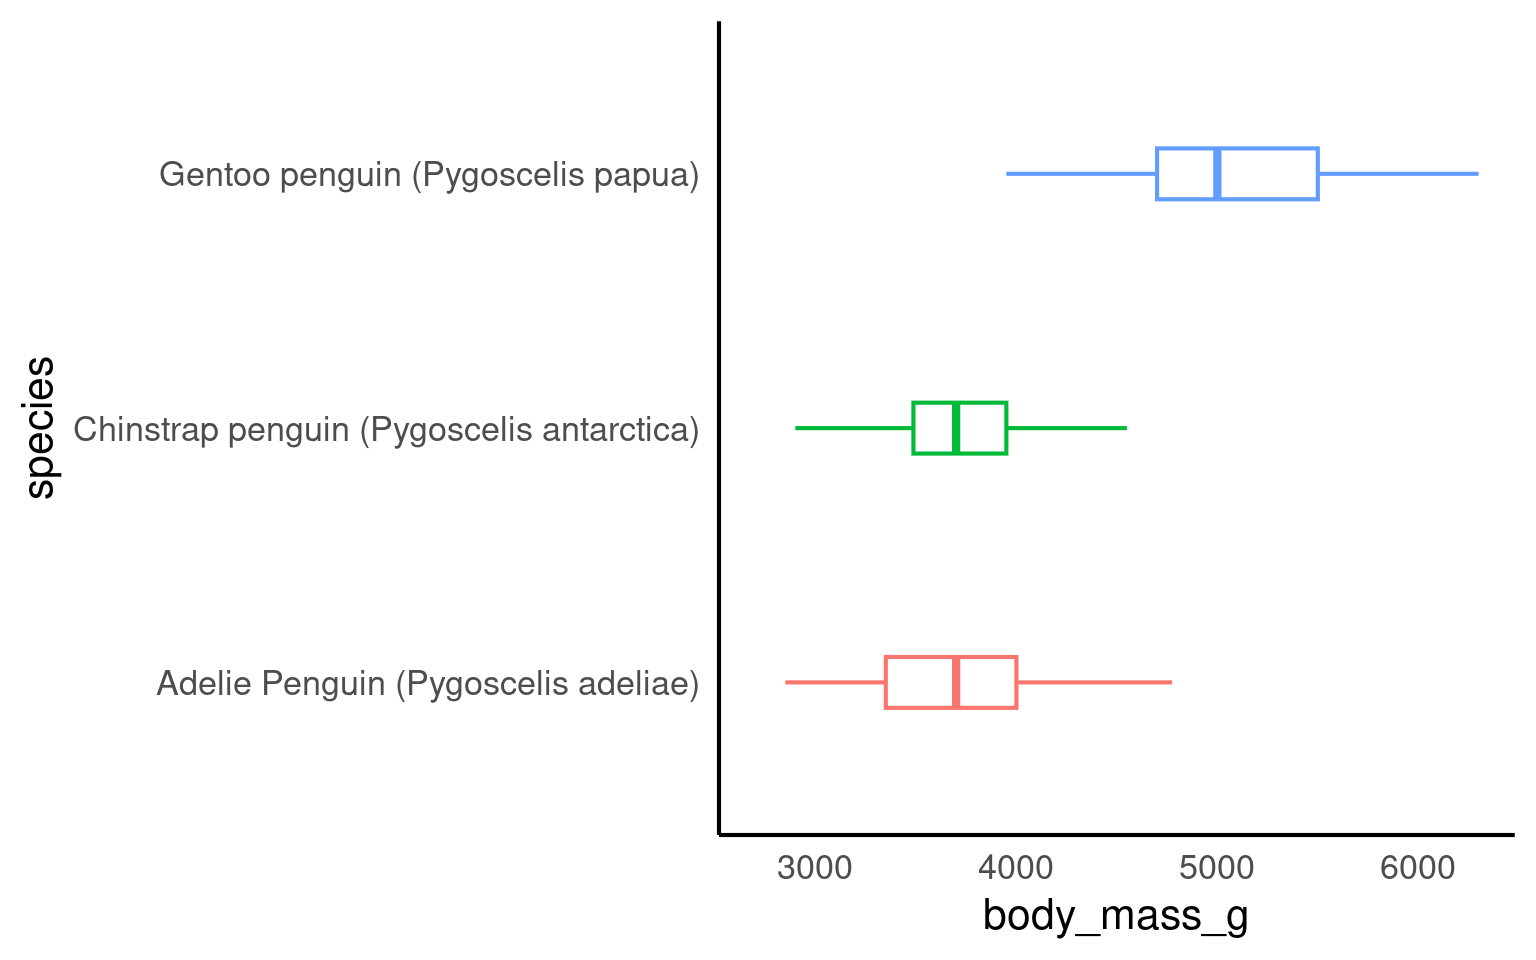
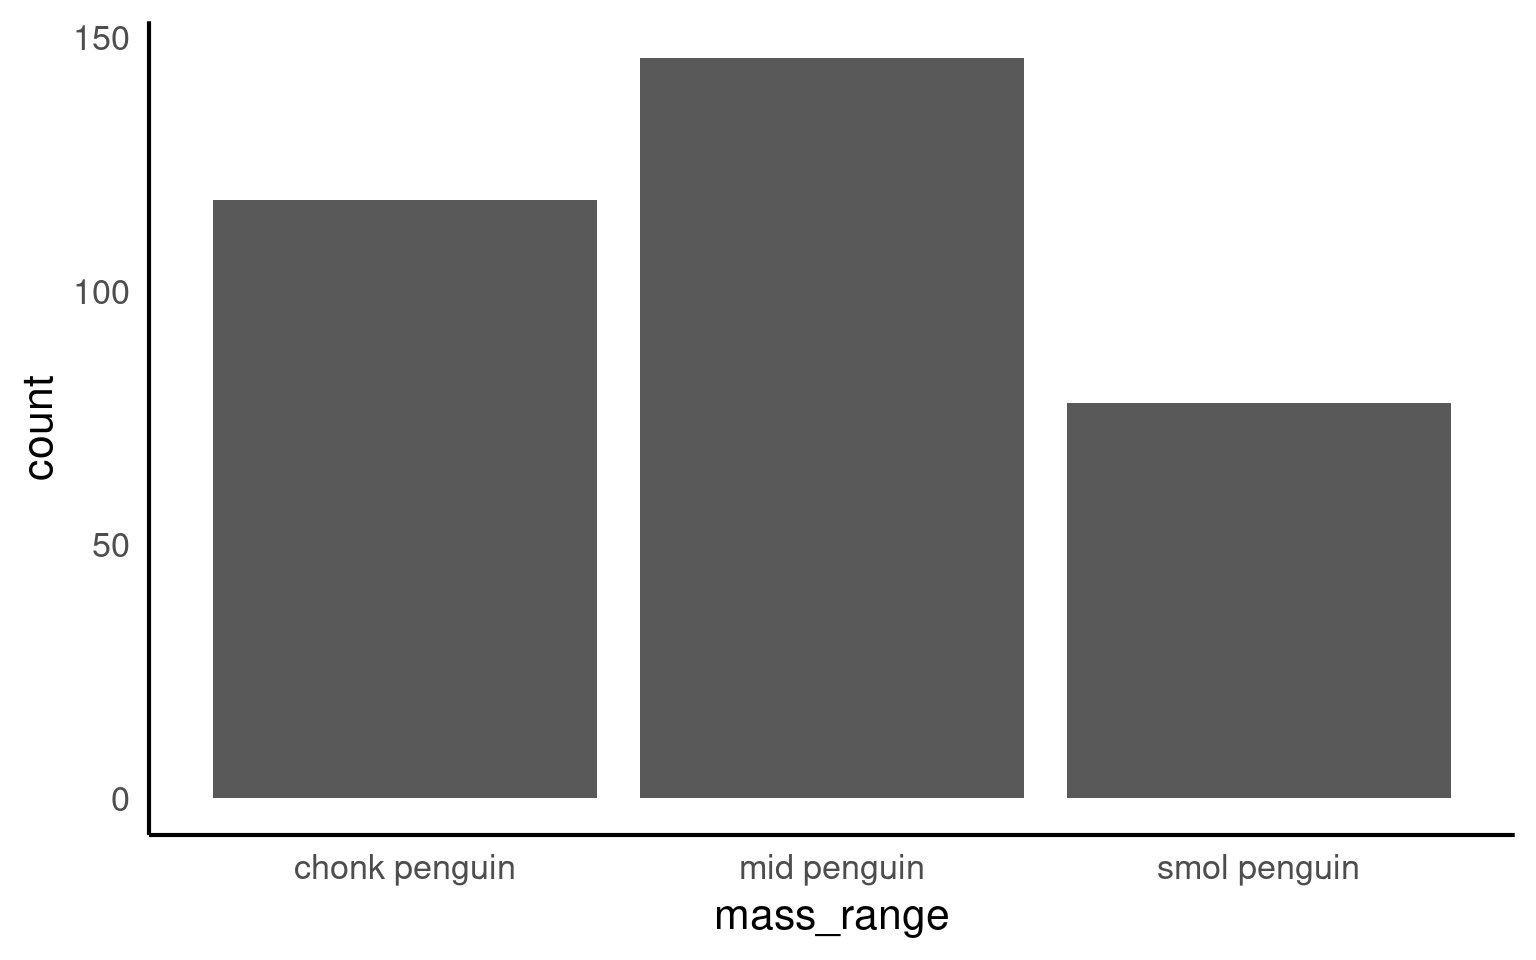
12.0.4 Factor bins
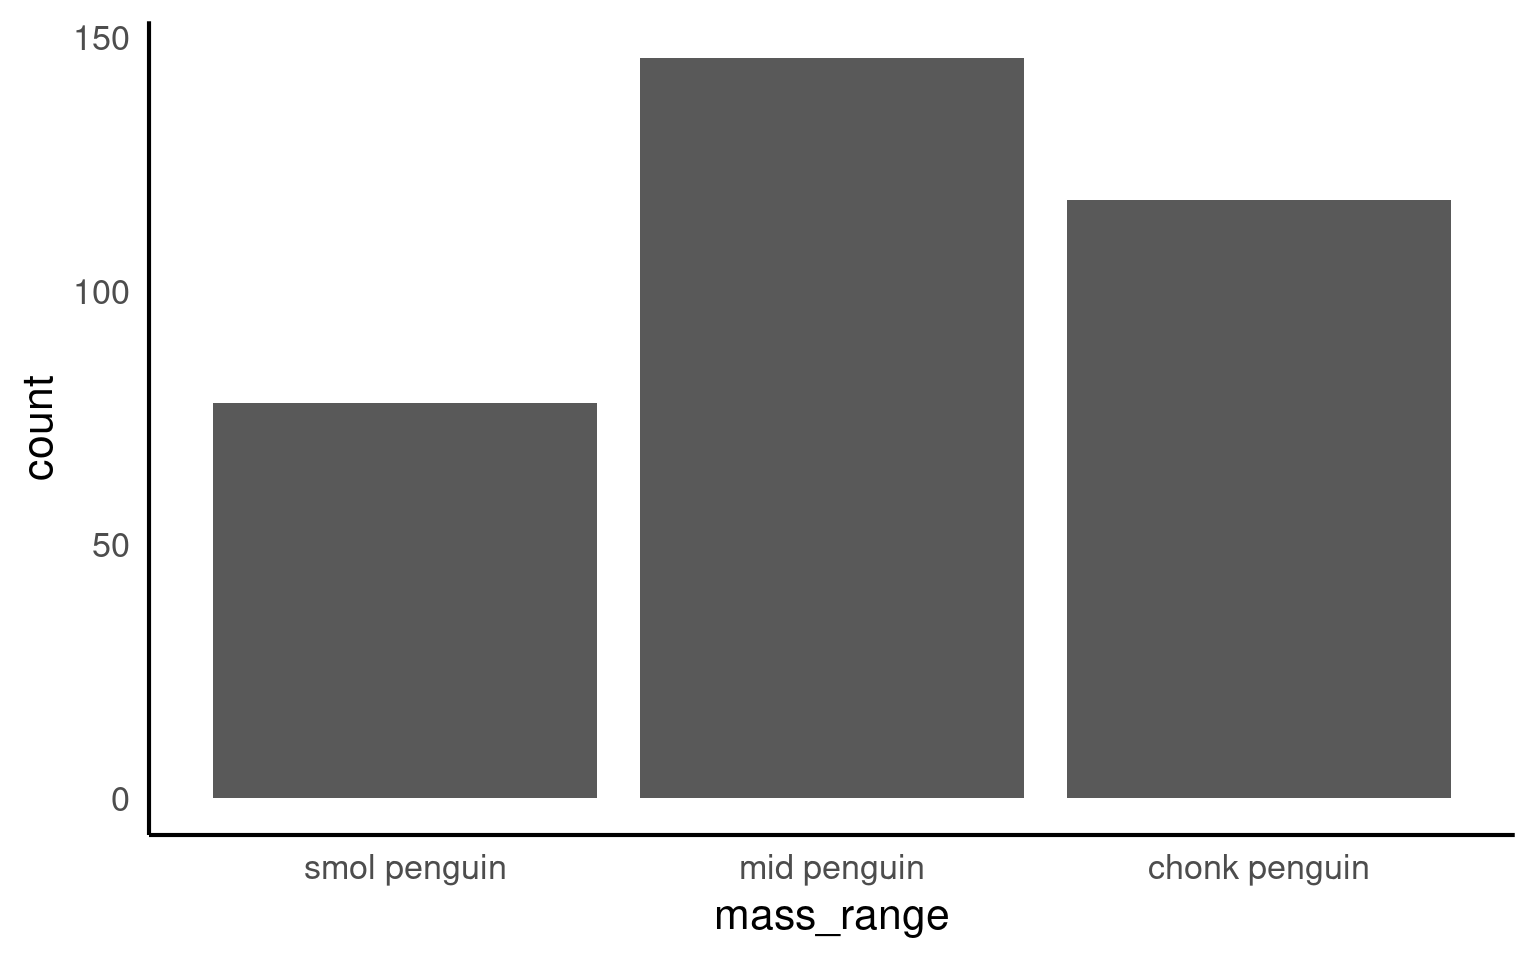
If we want to we can also bin continuous data into useful chunks:
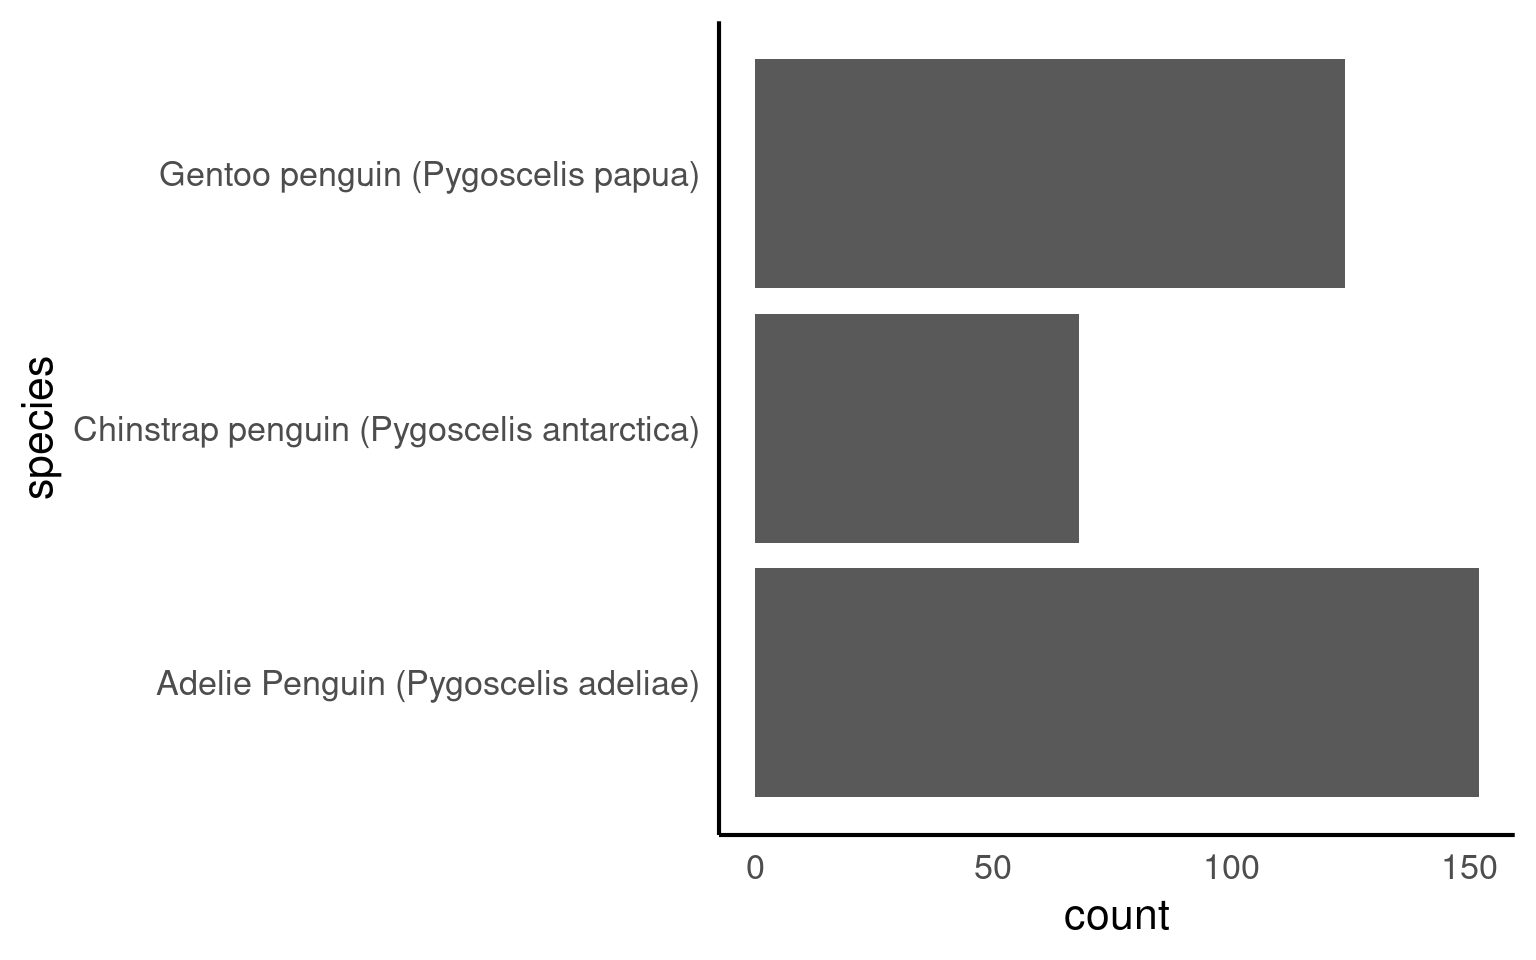
If we make a barplot, the order of the values on the x axis will typically be in alphabetical order for any character data
Your turn
To convert a character or numeric column to class factor, you can use any function from the forcats package. They will convert to class factor and then also perform or allow certain ordering of the levels - for example using forcats::fct_relevel() lets you manually specify the level order.
The function as_factor() simply converts the class without any further capabilities.
r unhide()
r hide("Solution")
Below we use mutate() and as_factor() to convert the column flipper_range from class character to class factor.
[1] "smol penguin" "mid penguin" "chonk penguin"Now when we call a plot, we can see that the x axis categories match the intrinsic order we have specified with our factor levels.