10 Missing data
Datasets often contain missing values. However, analysis and visualisation software can differ in their default response to missing values. They might drop missing values, provide a warning about them, or return an error. We don’t always know which response we’ll get, which can cause problems for us (possibly without our knowing) during analysis later on. This is why it’s important to clean missing values effectively.
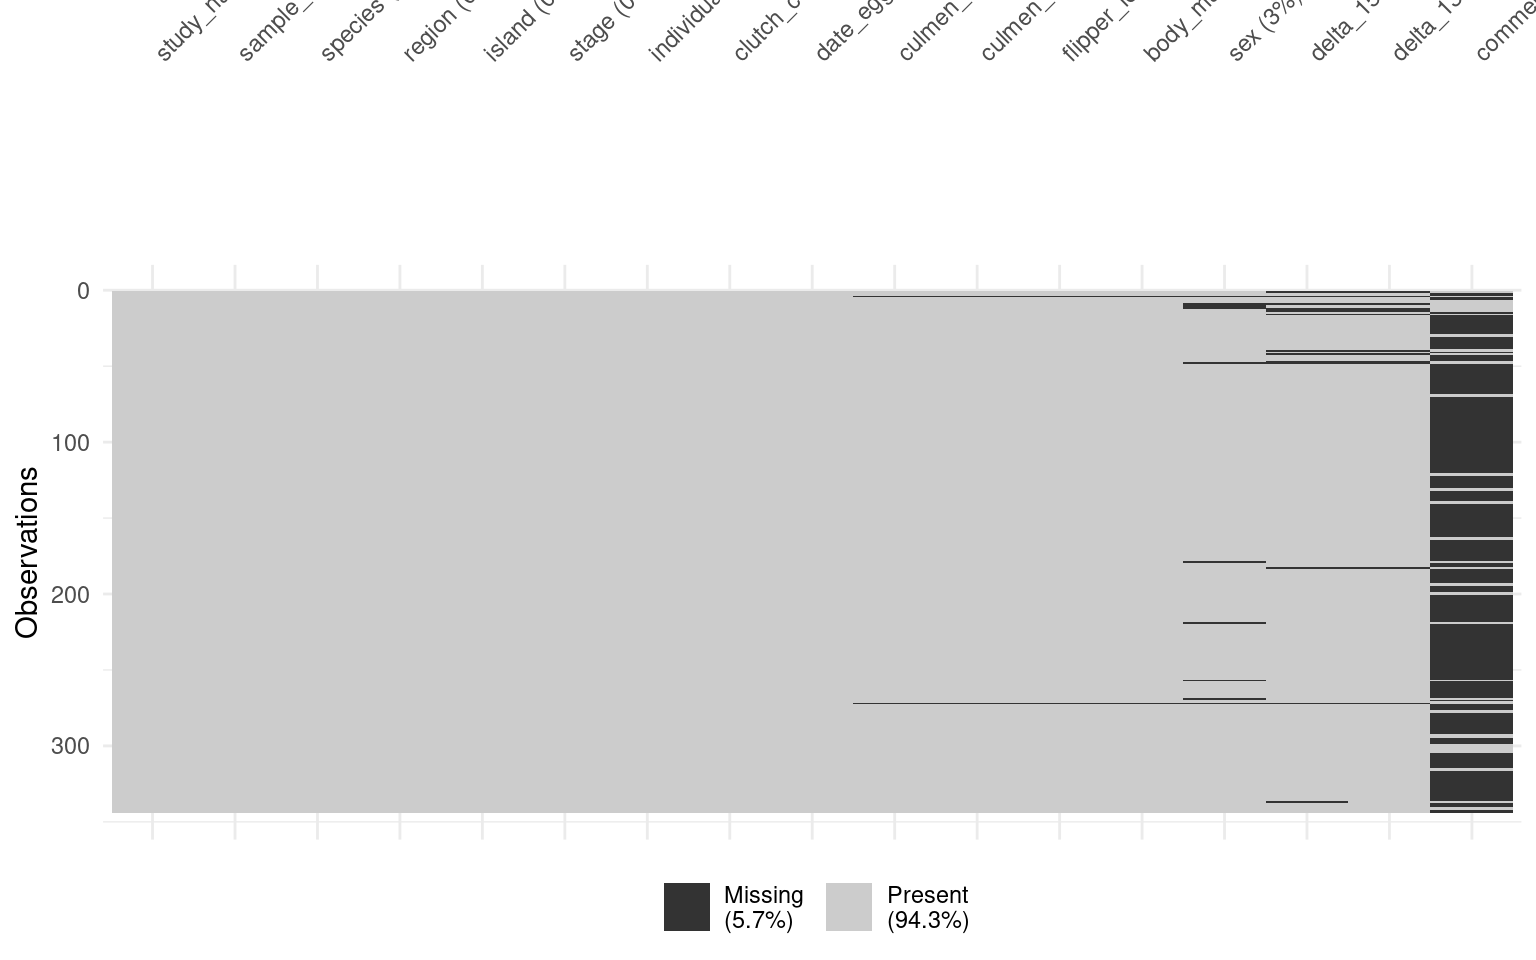
Understanding the nature of missing data can also be useful for informing how you proceed with analysis. For instance, understanding whether missing data are random or not can influence what you choose to do with them (e.g. remove vs. impute), which in turn can affect the results of statistical models based on those datasets. Identifying where missing data occur in a dataset is therefore an important part of exploratory data analysis. This chapter will show you how to detect and remove missing values.
Your turn
10.1 Find Missing values
There are numerous ways to identify missing values in your data. Here we illustrate a few ways with very different output types.
  study_name        sample_number      species             region
 Length:344         Min.   :  1.00   Length:344         Length:344
 Class :character   1st Qu.: 29.00   Class :character   Class :character
 Mode  :character   Median : 58.00   Mode  :character   Mode  :character
                    Mean   : 63.15
                    3rd Qu.: 95.25
                    Max.   :152.00

    island             stage           individual_id      clutch_completion
 Length:344         Length:344         Length:344         Length:344
 Class :character   Class :character   Class :character   Class :character
 Mode  :character   Mode  :character   Mode  :character   Mode  :character


   date_egg         culmen_length_mm culmen_depth_mm flipper_length_mm
 Length:344         Min.   :32.10    Min.   :13.10   Min.   :172.0
 Class :character   1st Qu.:39.23    1st Qu.:15.60   1st Qu.:190.0
 Mode  :character   Median :44.45    Median :17.30   Median :197.0
                    Mean   :43.92    Mean   :17.15   Mean   :200.9
                    3rd Qu.:48.50    3rd Qu.:18.70   3rd Qu.:213.0
                    Max.   :59.60    Max.   :21.50   Max.   :231.0
                    NA's   :2        NA's   :2       NA's   :2
  body_mass_g       sex              delta_15n        delta_13c
 Min.   :2700   Length:344         Min.   : 7.632   Min.   :-27.02
 1st Qu.:3550   Class :character   1st Qu.: 8.300   1st Qu.:-26.32
 Median :4050   Mode  :character   Median : 8.652   Median :-25.83
 Mean   :4202                      Mean   : 8.733   Mean   :-25.69
 3rd Qu.:4750                      3rd Qu.: 9.172   3rd Qu.:-25.06
 Max.   :6300                      Max.   :10.025   Max.   :-23.79
 NA's   :2                         NA's   :14       NA's   :13
   comments
 Length:344
 Class :character
 Mode  :character
| Name | penguins_clean_names |
| Number of rows | 344 |
| Number of columns | 17 |
| _______________________ | |
| Column type frequency: | |
| character | 10 |
| numeric | 7 |
| ________________________ | |
| Group variables | None |
Variable type: character
| skim_variable | n_missing | complete_rate | min | max | empty | n_unique | whitespace |
|---|---|---|---|---|---|---|---|
| study_name | 0 | 1.00 | 7 | 7 | 0 | 3 | 0 |
| species | 0 | 1.00 | 33 | 41 | 0 | 3 | 0 |
| region | 0 | 1.00 | 6 | 6 | 0 | 1 | 0 |
| island | 0 | 1.00 | 5 | 9 | 0 | 3 | 0 |
| stage | 0 | 1.00 | 18 | 18 | 0 | 1 | 0 |
| individual_id | 0 | 1.00 | 4 | 6 | 0 | 190 | 0 |
| clutch_completion | 0 | 1.00 | 2 | 3 | 0 | 2 | 0 |
| date_egg | 0 | 1.00 | 10 | 10 | 0 | 50 | 0 |
| sex | 11 | 0.97 | 4 | 6 | 0 | 2 | 0 |
| comments | 290 | 0.16 | 18 | 68 | 0 | 10 | 0 |
Variable type: numeric
| skim_variable | n_missing | complete_rate | mean | sd | p0 | p25 | p50 | p75 | p100 | hist |
|---|---|---|---|---|---|---|---|---|---|---|
| sample_number | 0 | 1.00 | 63.15 | 40.43 | 1.00 | 29.00 | 58.00 | 95.25 | 152.00 | ▇▇▆▅▃ |
| culmen_length_mm | 2 | 0.99 | 43.92 | 5.46 | 32.10 | 39.23 | 44.45 | 48.50 | 59.60 | ▃▇▇▆▁ |
| culmen_depth_mm | 2 | 0.99 | 17.15 | 1.97 | 13.10 | 15.60 | 17.30 | 18.70 | 21.50 | ▅▅▇▇▂ |
| flipper_length_mm | 2 | 0.99 | 200.92 | 14.06 | 172.00 | 190.00 | 197.00 | 213.00 | 231.00 | ▂▇▃▅▂ |
| body_mass_g | 2 | 0.99 | 4201.75 | 801.95 | 2700.00 | 3550.00 | 4050.00 | 4750.00 | 6300.00 | ▃▇▆▃▂ |
| delta_15n | 14 | 0.96 | 8.73 | 0.55 | 7.63 | 8.30 | 8.65 | 9.17 | 10.03 | ▃▇▆▅▂ |
| delta_13c | 13 | 0.96 | -25.69 | 0.79 | -27.02 | -26.32 | -25.83 | -25.06 | -23.79 | ▆▇▅▅▂ |
We can return all rows with a missing variable.
Or we can specify we just want to look at a specific columns NA:
| study_name | sample_number | species | region | island | stage | individual_id | clutch_completion | date_egg | culmen_length_mm | culmen_depth_mm | flipper_length_mm | body_mass_g | sex | delta_15n | delta_13c | comments |
|---|---|---|---|---|---|---|---|---|---|---|---|---|---|---|---|---|
| PAL0708 | 4 | Adelie Penguin (Pygoscelis adeliae) | Anvers | Torgersen | Adult, 1 Egg Stage | N2A2 | Yes | 16/11/2007 | NA | NA | NA | NA | NA | NA | NA | Adult not sampled. |
| PAL0910 | 120 | Gentoo penguin (Pygoscelis papua) | Anvers | Biscoe | Adult, 1 Egg Stage | N38A2 | No | 01/12/2009 | NA | NA | NA | NA | NA | NA | NA | Adult not sampled. Nest never observed with full clutch. |
10.2 Remove missing values
Three main strategies:
Drop all rows with any NA (
drop_na()): simple but can remove lots - the nuclear optionDrop NAs in specific columns only.
Keep rows, use
na.rm = TRUEinside summary functions (least destructive).
10.2.1 drop_na() on everything before we start.
Using drop_na() to remove rows that contain any missing values across all variables can be useful, but it also runs the risk of losing a large portion of the data.
Pros: It’s a simple, all-in-one solution for datasets where missing values are widespread and problematic.
Cons: This method may remove entire rows of data, even if the missing value is only in a single, unimportant column. This can lead to significant data loss if many rows have missing values in non-critical variables.
10.2.2 drop_na() on a particular variable.
Another approach is to remove rows with missing data in a specific variable, such as body_mass_g. This is less drastic but still needs to be done thoughtfully, especially if you overwrite the original dataset with the modified version. It’s often better to drop NAs temporarily for specific analyses or calculations.
Pros: You retain more data because you only remove rows with missing values in the column that matters for your current analysis.
Cons: You might still lose useful information from other columns. If you overwrite the dataset permanently (e.g., using
penguins_clean_names <- penguins_clean_names |> drop_na(body_mass_g)), you can’t recover the dropped rows without reloading the data.
10.2.3 Use arguments inside functions
A more cautious approach is to handle missing data within summary or calculation functions, using the na.rm = TRUE argument. Many summary functions (like mean(), median(), or sum()) include this argument, which, when set to TRUE, excludes NA values from the calculation. This allows you to keep missing values in the dataset but ignore them only when performing calculations.
Pros: This is the least destructive option because it allows you to handle missing data without removing any rows from the dataset. You only exclude
NAvalues during specific calculations.Cons: This doesn’t remove missing data, so you need to ensure that they won’t cause issues later in other analyses (e.g., regressions or visualizations).
10.3 Summary
This chapter showed ways to find and remove different types of missing records from your dataset. It’s important to note that there might not be a single cleaned dataset without any missing values. You might find that in the same workflow, you will clean your dataset in multiple ways to preserve rows that are missing some, but not all, information. For example, some records may have complete taxonomic identification but lack spatial coordinates, while others have spatial coordinates but lack taxonomic information. Depending on the type of analysis you intend to perform, you may need to adjust your data cleaning approach accordingly.
For a more comprehensive resource about missing values, including how to clean, visually represent, and impute them, check out The Missing Book.