2 R Basics
To load packages we use the function library(). Typically you would start any analysis script by loading all of the packages you need.
The tidyverse is an opinionated collection of R packages designed for data science. All packages share an underlying design philosophy, grammar, and data structures. This means the functions across the tidyverse are all designed to work together and make the process of data science easier.
2.1 Using packages
Run the below code to load the tidyverse package. You can do this regardless of whether you are using your own computer or the cloud.
You will get what looks like an error message - it's not. It's just R telling you what it's done. You should read this it gives you a full list of the packages it has made available to you. One of these should look familiar to you from last week?
Now that we've loaded the tidyverse package we can use any of the functions it contains but remember, you need to run the library() function every time you start R.
In order to use a package, you must first install it. The following code installs the package tidyverse, a package we will use very frequently.
If you are working on your own computer, use the below code to install the tidyverse.
install.packages("tidyverse")You only need to install a package once, however, each time you start R you need to load the packages you want to use, in a similar way that you need to install an app on your phone once, but you need to open it every time you want to use it.
If you get an error message that says something like "WARNING: Rtools is required to build R packages" you may need to download and install an extra bit of software called Rtools.
2.2 Package updates
In addition to updates to R and R Studio, the creators of packages also sometimes update their code. This can be to add functions to a package, or it can be to fix errors. One thing to avoid is unintentionally updating an installed package. When you run install.packages() it will always install the latest version of the package and it will overwrite any older versions you may have installed. Sometimes this isn't a problem, however, sometimes you will find that the update means your code no longer works as the package has changed substantially. It is possible to revert back to an older version of a package but try to avoid this anyway.
To avoid accidentally overwriting a package with a later version, you should never include install.packages() in your analysis scripts in case you, or someone else runs the code by mistake. Remember, the server will already have all of the packages you need for this course so you only need to install packages if you are using your own machine.
2.3 Package conflicts
There are thousands of different R packages with even more functions. Unfortunately, sometimes different packages have the same function names. For example, the packages dplyr and MASS both have a function named select(). If you load both of these packages, R will produce a warning telling you that there is a conflict.
package �dplyr� was built under R version 3.6.3
Attaching package: �dplyr�

The following objects are masked from �package:stats�:

    filter, lag

The following objects are masked from �package:base�:

    intersect, setdiff, setequal, union


Attaching package: �MASS�

The following object is masked from �package:dplyr�:

    select
In this case, R is telling you that the function select() in the dplyr package is being hidden (or 'masked') by another function with the same name. If you were to try and use select(), R would use the function from the package that was loaded most recently - in this case it would use the function from MASS.
If you want to specify which package you want to use for a particular function you can use code in the format package::function, for example:
Why do we get naming conflicts?
This is because R is open source software. Anyone can write and submit useful R packages. As a result it is impossible to make sure that there are NEVER any functions with identical names.
2.4 Objects
A large part of your coding will involve creating and manipulating objects. Objects contain stuff, and we made our first R objects in the previous chapter. The values contained in an object can be numbers, words, or the result of operations and analyses.You assign content to an object using <-.
2.4.1 Activity 1: Create some objects
Copy and paste the following code into the console, change the code so that it uses your own name and age and run it. You should see that name, age, today, new_year, and data appear in the environment pane.
name <- "emily"
age <- 16 + 19
today <- Sys.Date()
new_year <- as.Date("2022-01-01")
data <- rnorm(n = 10, mean = 15, sd = 3)
What command should we use if you need help to understand the function rnorm()?
`
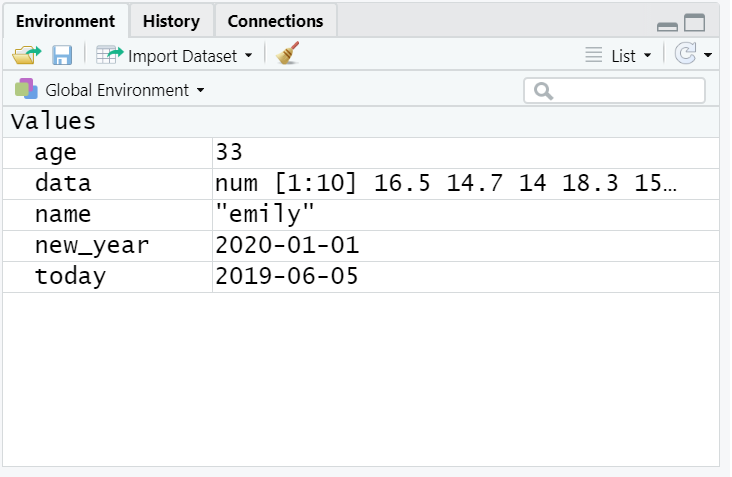
Figure 2.1: Objects in the environment
Note that in these examples, name,age, and new_year would always contain the values emily, 35, and the date of New Year's Day 2021, however, today will draw the date from the operating system and data will be a randomly generated set of data so the values of these objects will not be static.
As a side note, if you ever have to teach programming and statistics, don't use your age as an example because every time you have to update your teaching materials you get a reminder of the fragility of existence and your advancing age. 2021 update: I have now given up updating my age, I will remain forever 35.
Importantly, objects can be involved in calculations and can interact with each other. For example:
age + 10
new_year - today
mean(data)
## [1] 45
## Time difference of -216 days
## [1] 16.63193Finally, you can store the result of these operations in a new object:
decade <- age + 10
You may find it helpful to read <- as contains, e.g., name contains the text emily.
You will constantly be creating objects throughout this course and you will learn more about them and how they behave as we go along, however, for now it is enough to understand that they are a way of saving values, that these values can be numbers, text, or the result of operations, and that they can be used in further operations to create new variables.
You may also see objects referred to as 'variables'. There is a difference between the two in programming terms, however, they are used synonymously very frequently.
2.5 Vectors
We have been working with R objects containing a single element of data, but we will more commonly work with vectors. A vector is a sequence of elements, all of the same data type. These could be logical, numerical, character etc.
numeric_vector <- c(1,2,3)

character_vector <- c("fruits", "vegetables", "seeds")

logical_vector <- c(TRUE, TRUE, FALSE)
The function c lets you 'concatenate' or link each of these separate elements together into a single vector.
2.6 Dataframes and tibbles
No we have looked at R objects that contain:
single elements of data
multiple elements of the same data type - vectors
But most often when we import data into R it is put into an object called a tibble which is a type of dataframe.
A dataframe is data structure that organises data into a table. Dataframes can have a mix of different types of data in them. Each column in a dataframe is a different vector, and each row is a different element within the vectors.
Let's have a quick go at making our own tibble from scratch.
# make some variables/ vectors
person <- c("Mark", "Phil", "Becky", "Tony")

hobby <- c("kickboxing", "coding", "dog walking", "car boot sales")

awesomeness <- c(1,100,1,1)
Use str() on an object or vector to find out important information, like the data type of each vector and how many elements it contains.
Now we put these vectors together, where they become the variables in a new tibble using the function tibble()
# make a tibble
my_data <- tibble(person, hobby, awesomeness)
my_data
# A tibble: 4 x 3
person hobby awesomeness
<chr> <chr> <dbl>
1 Mark kickboxing 1
2 Phil coding 100
3 Becky dog walking 1
4 Tony car boot sales 1Have a go at messing about with your script and figure out what each of the functions below does.
2.7 Organising data in wide and long formats
There are two main conventions for dataframes in R, these are wide and long formats.
A wide data format does not repeat values in the first column, data relating to the same "measured thing" are found in different columns
A long data format is where we have a different column for each type of thing we have measures in our data. Each variable has a unique column.
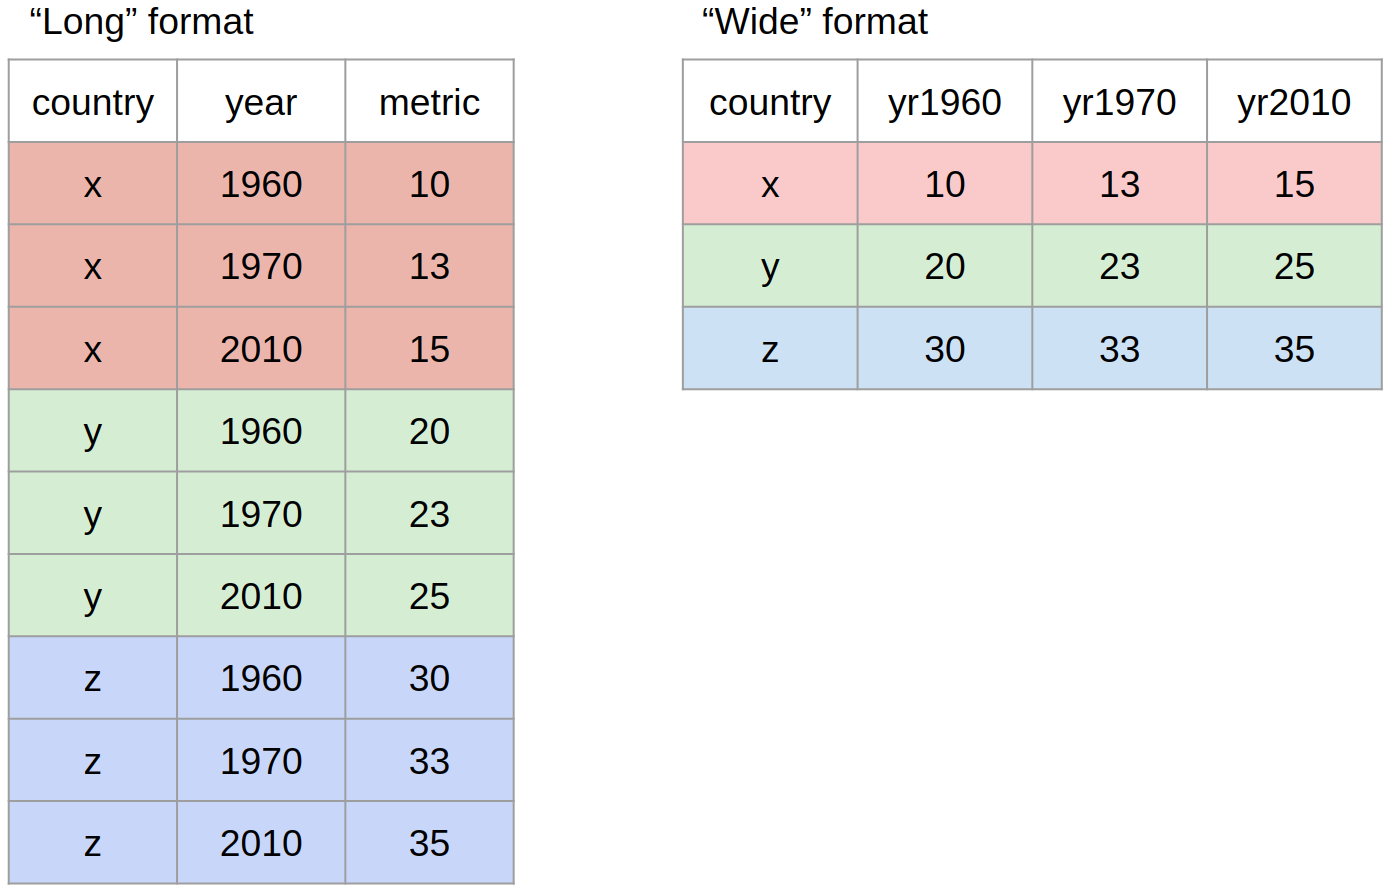
Figure 2.2: A visual representation of long and wide format data shapes
While neither wide or long data is more correct than the other, we will work with long data as it is clearer how many distinct types of variables there are in our data and the tools we will be using from the tidyverse are designed to work with long data.
2.8 Using pivot functions
There are functions found as part of the tidyverse that can help us to reshape data.
tidyr::pivot_wider()- from long to wide formattidyr::pivot_longer()- from wide to long format
 country <- c("x", "y", "z")
 yr1960 <-  c(10, 20, 30)
 yr1970 <-  c(13, 23, 33)
 yr2010 <-  c(15, 25, 35)

country_data <- tibble(country, yr1960, yr1970, yr2010)
country_data| country | yr1960 | yr1970 | yr2010 |
|---|---|---|---|
| x | 10 | 13 | 15 |
| y | 20 | 23 | 25 |
| z | 30 | 33 | 35 |
pivot_longer(data = country_data,
             cols = yr1960:yr2010,
             names_to = "year",
             names_prefix = "yr",
             values_to = "metric")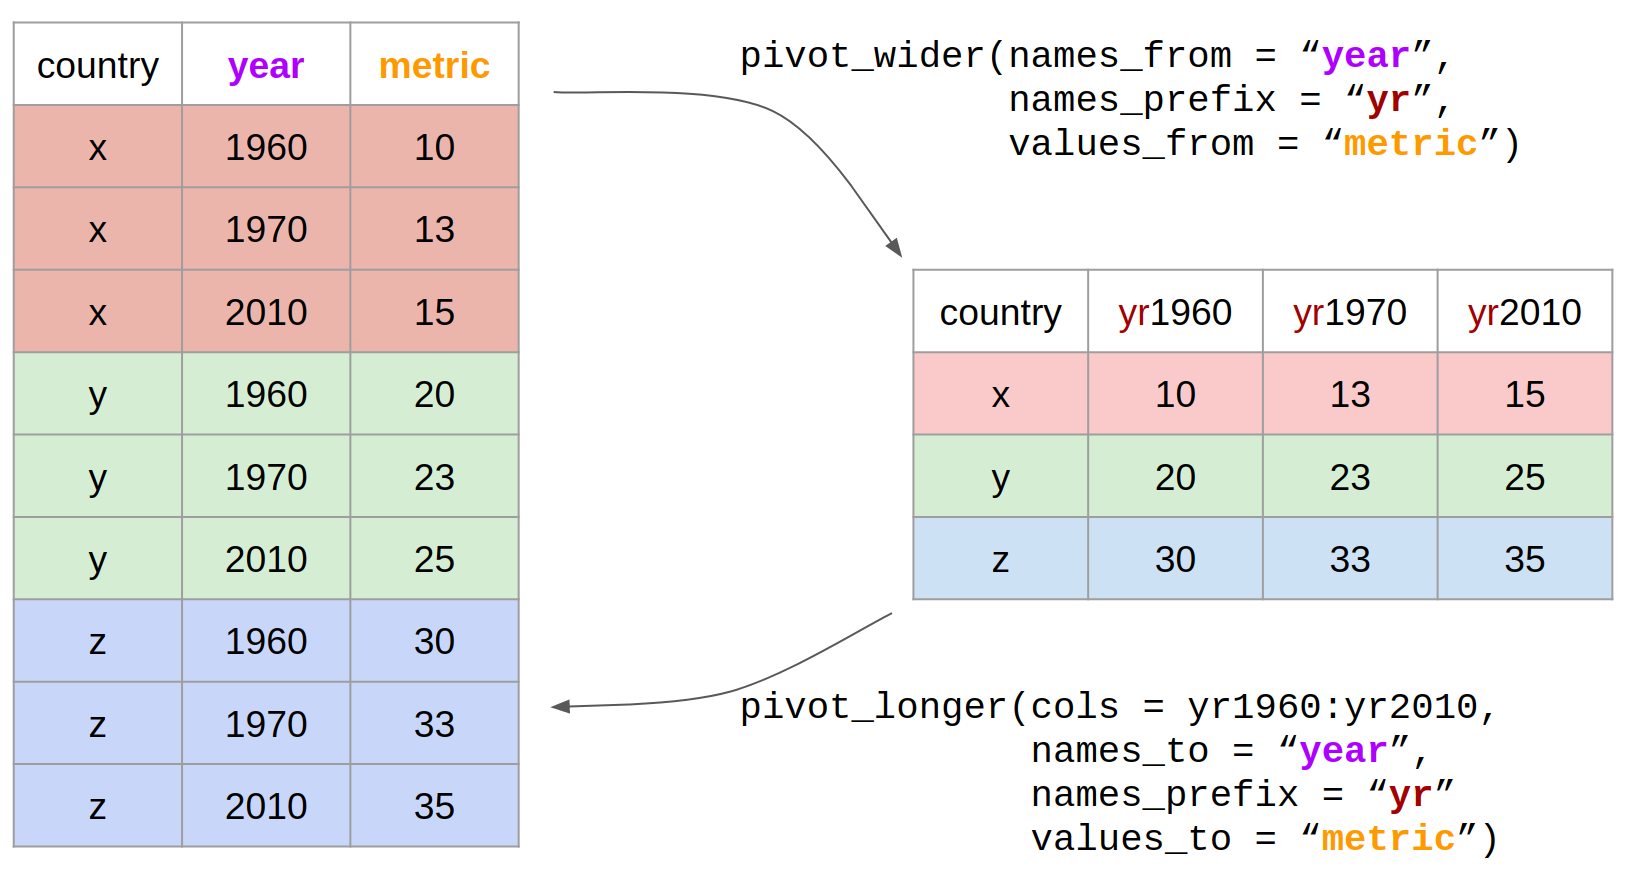
Figure 2.3: Reshaping data with pivot
To save these changes to your data format, you must assign this to an object, and you have two options
Use the same name as the original R object, this will overwrite the original with the new format
Use a new name for the reformatted data both R objects will exist in your Environment
Neither is more correct than the other but be aware of what you are doing.
2.9 Looking after the environment
If you've been writing a lot of code you may find that the environment pane (or workspace) has become cluttered with many objects. This can make it difficult to figure out which object you need and therefore you run the risk of using the wrong data frame. If you're working on a new dataset, or if you've tried lots of different code before getting the final version, it is good practice to remember to clear the environment to avoid using the wrong object. You can do this in several way.
- To remove individual objects, you can type
rm(object_name)in the console. Try this now to remove one of the objects you created in the previous section. - To clear all objects from the environment run
rm(list = ls())in the console. - To clear all objects from the environment you can also click the broom icon in the environment pane.
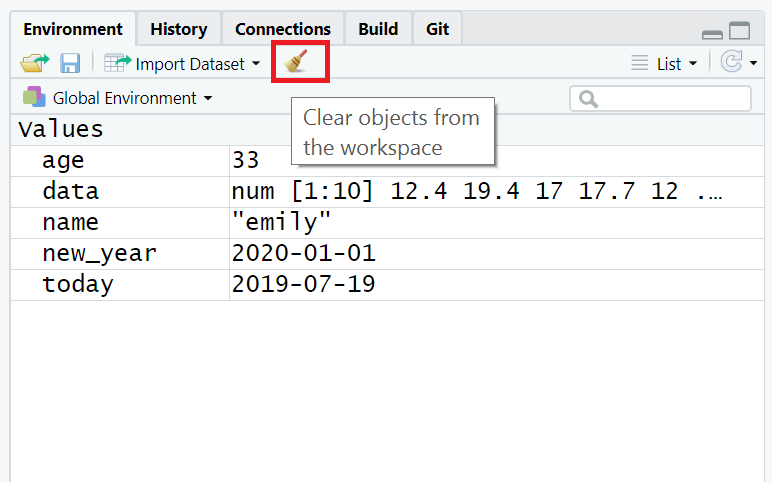
Figure 2.4: Clearing the workspace
2.10 Global options
By default, when you open R Studio it will show you what you were last working on, including your code and any objects you have created. This might sound helpful, but actually it tends to cause more problems than it's worth because it means that you risk accidentally using an old version of an object. We recommend changing the settings so that each time you start R Studio, it opens a fresh copy. You can do this by clicking Tools - Global Options and then deselecting boxes so that it looks like the below.
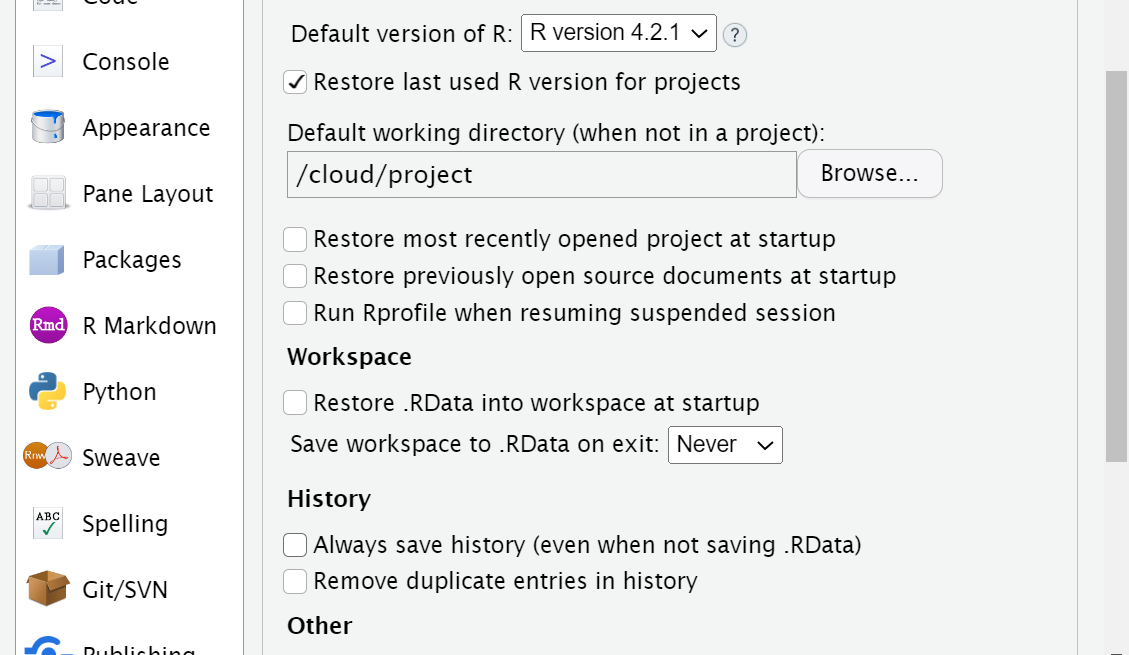
Figure 2.5: Set these options to increase reproducibility
Restore .RData into workspace at startup
Save workspace to .RData on exit
2.11 R sessions
When you open up R and start writing code, loading packages, and creating objects, you're doing so in a new session. In addition to clearing the workspace, it can sometimes be useful to start a new session. This will happen automatically each time you start R on your computer, although sessions can persist on the cloud. If you find that your code isn't working and you can't figure out why, it might be worth starting a new session. This will clear the environment and detach all loaded packages - think of it like restarting your phone.
2.12 Activity 2
Click 'Session - Restart R'.
Have you tried turning it off and on again? It is vital to restart R regularly. Restarting R helps to avoid accidentally using the wrong data or functions stored in the environment. Restarting R only takes a second and we do it several times per day! Once you get used to saving everything in a script, you’ll always be happy to restart R. This will help you develop robust and reproducible data analysis skills.
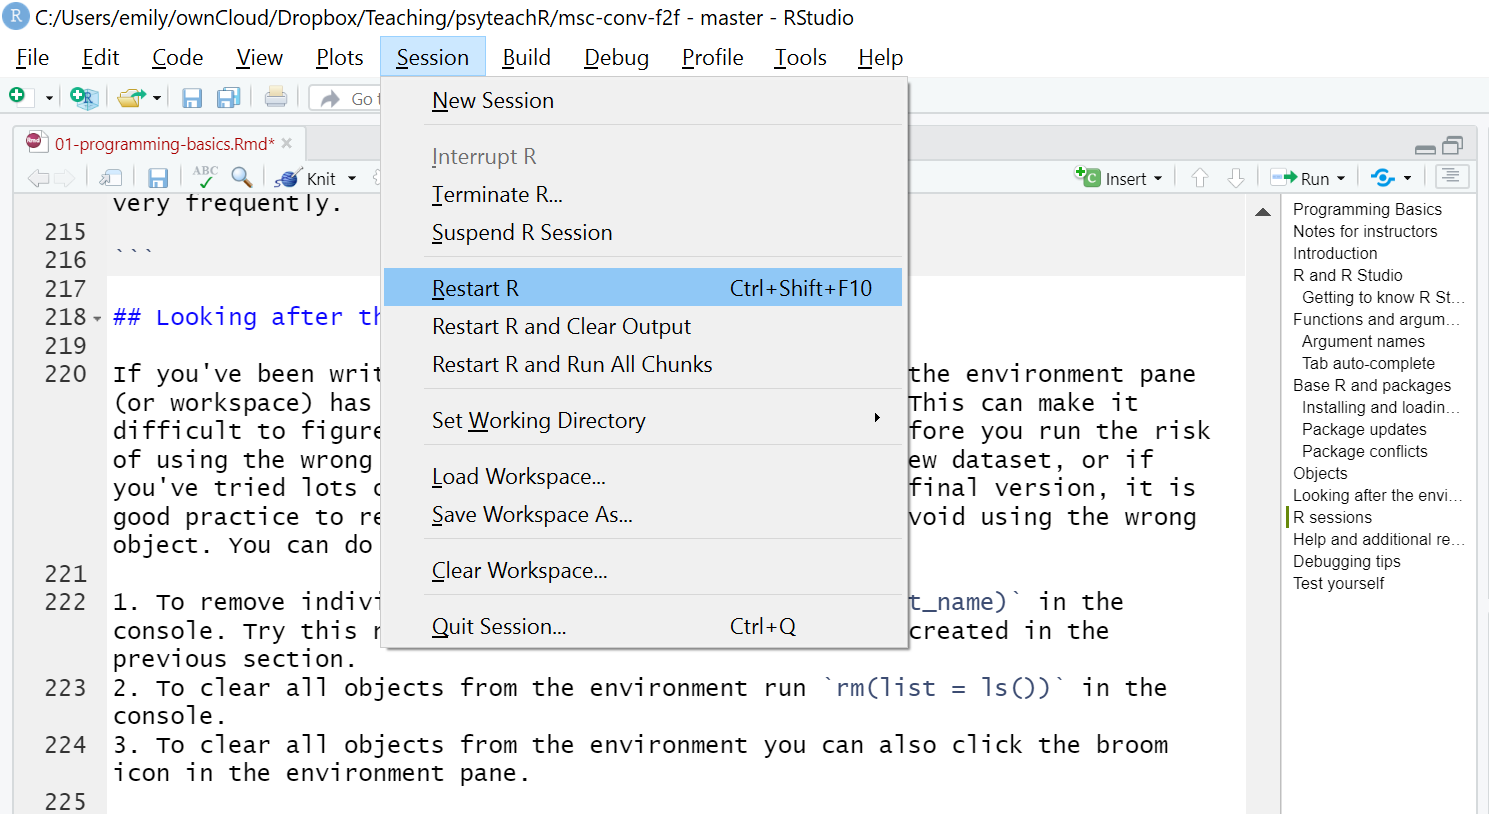
Figure 2.6: The truth about programming
This does not mean you can’t or shouldn’t ever save your work in .RData/.rda files.
But it is best to do it consciously and load exactly what you want to load. Letting R silently save and load everything for you may also include broken data or objects.
2.13 How to cite R and RStudio
You may be some way off writing a scientific report where you have to cite and reference R, however, when the time comes it is important to do so to the people who built it (most of them for free!) credit. You should provide separate citations for R, RStudio, and the packages you use.
To get the citation for the version of R you are using, simply run the citation() function which will always provide you with he most recent citation.
citation()##
## To cite R in publications use:
##
## R Core Team (2019). R: A language and environment for statistical
## computing. R Foundation for Statistical Computing, Vienna, Austria.
## URL https://www.R-project.org/.
##
## A BibTeX entry for LaTeX users is
##
## @Manual{,
## title = {R: A Language and Environment for Statistical Computing},
## author = {{R Core Team}},
## organization = {R Foundation for Statistical Computing},
## address = {Vienna, Austria},
## year = {2019},
## url = {https://www.R-project.org/},
## }
##
## We have invested a lot of time and effort in creating R, please cite it
## when using it for data analysis. See also 'citation("pkgname")' for
## citing R packages.To generate the citation for any packages you are using, you can also use the citation() function with the name of the package you wish to cite.
citation("tidyverse")##
## Wickham et al., (2019). Welcome to the tidyverse. Journal of Open
## Source Software, 4(43), 1686, https://doi.org/10.21105/joss.01686
##
## A BibTeX entry for LaTeX users is
##
## @Article{,
## title = {Welcome to the {tidyverse}},
## author = {Hadley Wickham and Mara Averick and Jennifer Bryan and Winston Chang and Lucy D'Agostino McGowan and Romain François and Garrett Grolemund and Alex Hayes and Lionel Henry and Jim Hester and Max Kuhn and Thomas Lin Pedersen and Evan Miller and Stephan Milton Bache and Kirill Müller and Jeroen Ooms and David Robinson and Dana Paige Seidel and Vitalie Spinu and Kohske Takahashi and Davis Vaughan and Claus Wilke and Kara Woo and Hiroaki Yutani},
## year = {2019},
## journal = {Journal of Open Source Software},
## volume = {4},
## number = {43},
## pages = {1686},
## doi = {10.21105/joss.01686},
## }To generate the citation for the version of RStudio you are using, you can use the RStudio.Version() function:
RStudio.Version()Finally, here's an example of how that might look in the write-up of your method section:
Analysis was conducted using R ver 4.0.0 (R Core Team, 2020), RStudio (Rstudio Team, 2020), and the tidyverse range of packages (Wickham, 2017).
As noted, you may not have to do this for a while, but come back to this when you do as it's important to give the open-source community credit for their work.
2.14 Help and additional resources
Figure 2.7: The truth about programming
Getting good at programming really means getting good trying stuff out, searching for help online, and finding examples of code to copy. If you are having difficulty with any of the exercises contained in this book then you can ask for help on Teams, however, learning to problem-solve effectively is a key skill that you need to develop throughout this course.
Use the help documentation. If you're struggling to understand how a function works, remember the
?functionandhelp()command.If you get an error message, copy and paste it in to Google - it's very likely someone else has had the same problem.
If you are struggling to produce a particular output or process - try organising your google searches to include key terms such as "in R" or "tidyverse". - e.g. "how to change character strings into NA values with tidyverse"
The official Cheatsheets are a great resource to keep bookmarked.
Remember to ask for help
-
In addition to these course materials there are a number of excellent resources for learning R:
- StackOverflow
- R for Data Science
- Search or use the #rstats hashtag on Twitter
2.15 Debugging tips
A large part of coding is trying to figure why your code doesn't work and this is true whether you are a novice or an expert. As you progress through this course you should keep a record of mistakes you make and how you fixed them. In each chapter we will provide a number of common mistakes to look out for but you will undoubtedly make (and fix!) new mistakes yourself.
2.15.1 Prevent errors
Read console outputs as you go
Check that functions are producing the output you expect
Build complex code in simple stages
2.15.2 Fix errors
Have you loaded the correct packages for the functions you are trying to use? One very common mistake is to write the code to load the package, e.g.,
library(tidyverse)but then forget to run it.Have you made a typo? Remember
datais not the same asDATAandt.testis not the same ast_test.Is there a package conflict? Have you tried specifying the package and function with
package::function?Is it definitely an error? Not all red text in R means an error - sometimes it is just giving you a message with information.
2.16 Activity 7: Test yourself
Question 1. Why should you never include the code install.packages() in your analysis scripts?
Remember, when you run install.packages() it will always install the latest version of the package and it will overwrite any older versions of the package you may have installed.
Question 2. What will the following code produce?
rnorm(6, 50, 10)The default form for rnorm() is rnorm(n, mean, sd). If you need help remembering what each argument of a function does, look up the help documentation by running ?rnorm
Question 3. If you have two packages that have functions with the same name and you want to specify exactly which package to use, what code would you use?
You should use the form package::function, for example dplyr::select. Remember that when you first load your packages R will warn you if any functions have the same name - remember to look out for this!
Question 4. Which of the following is most likely to be an argument?
Question 5. An easy way to spot functions is to look for .
Question 6. The job of <- is to send the output from the function to a/an .
Question 7. A vector must always contain elements of the same data type (e.g logical, character, numeric) .
Question 8. A dataframe/tibble must always contain elements of the same data type