21 Quarto quick reference
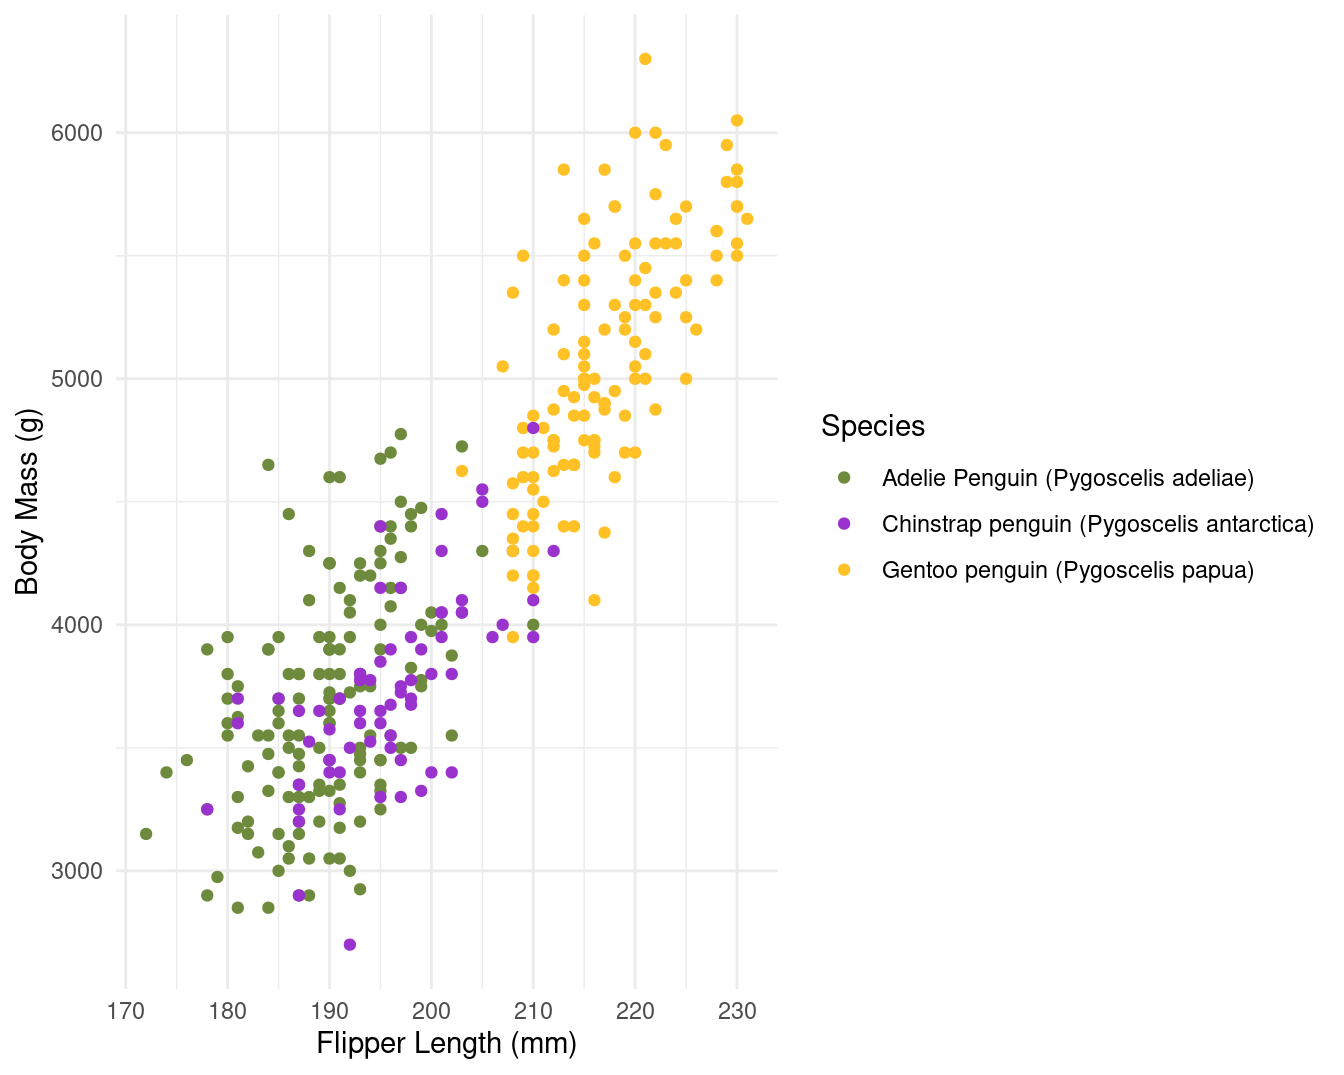
ggplot
Size options for figures
fig.widthandfig.heightenable to set width and height of R produced figures. The default value is set to 7 (inches). When I play with these options, I prefer using only one of them (fig.width).fig.aspsets the height-to-width ratio of the figure. It’s easier in my mind to play with this ratio than to give a width and a height separately. The default value of fig.asp is NULL but I often set it to(0.8), which often corresponds to the expected result.
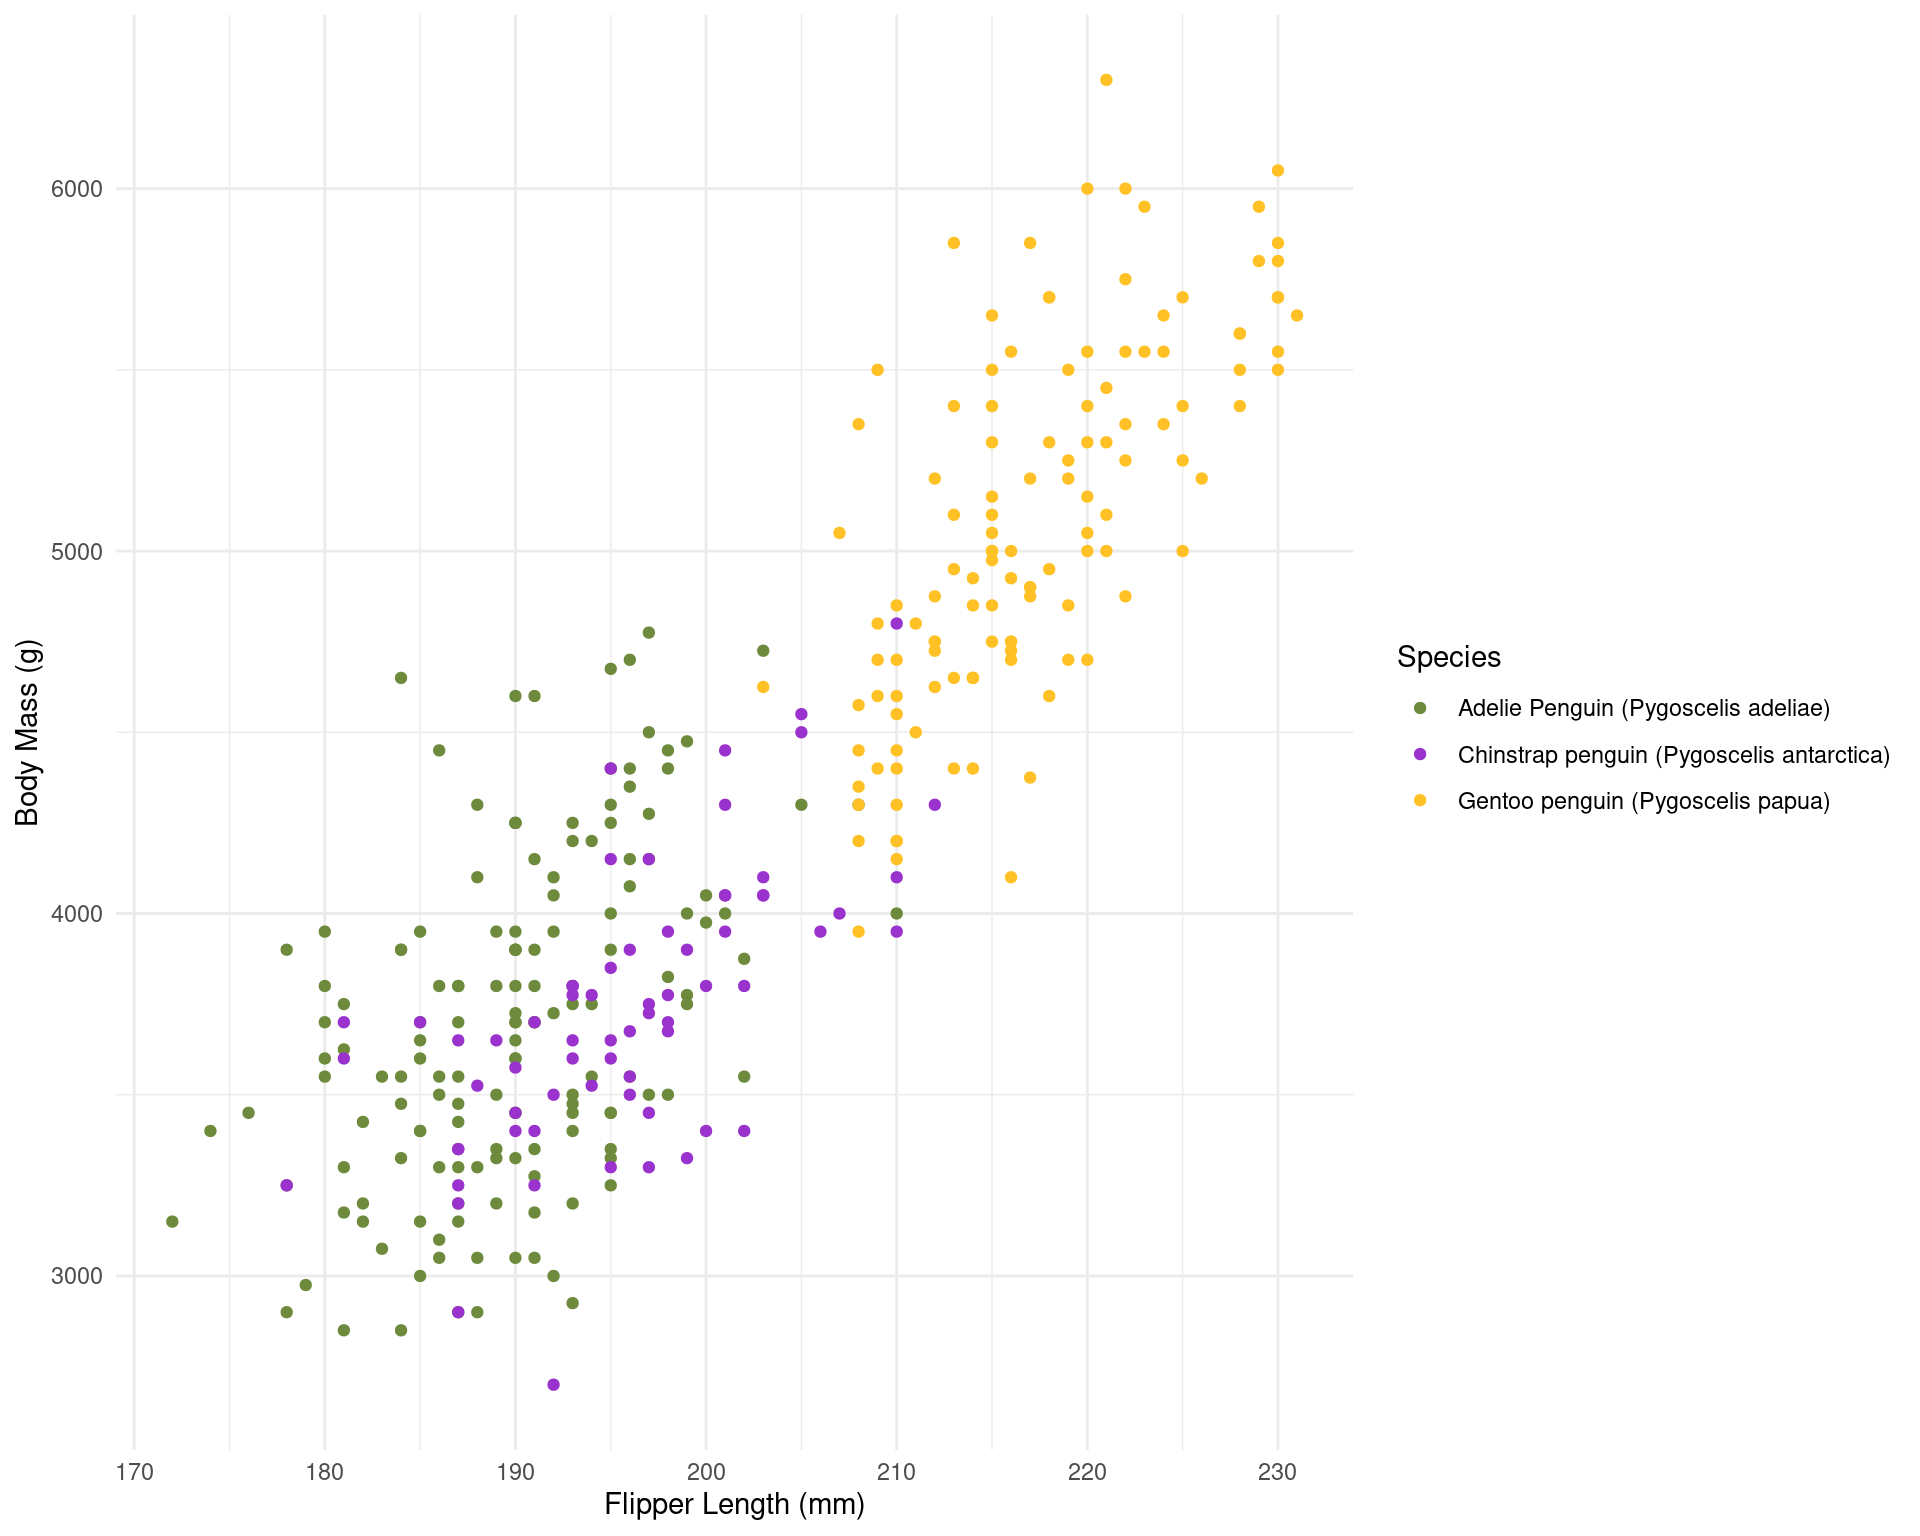
Size options of figures produced by R have consequences on relative sizes of elements in this figures. For a ggplot2 figure, these elements will remain to the size defined in the used theme, whatever the chosen size of the figure. Therefore a huge size can lead to a very small text and vice versa.
The base font size is 11 pts by default. You can change it with the base_size argument in the theme you’re using.
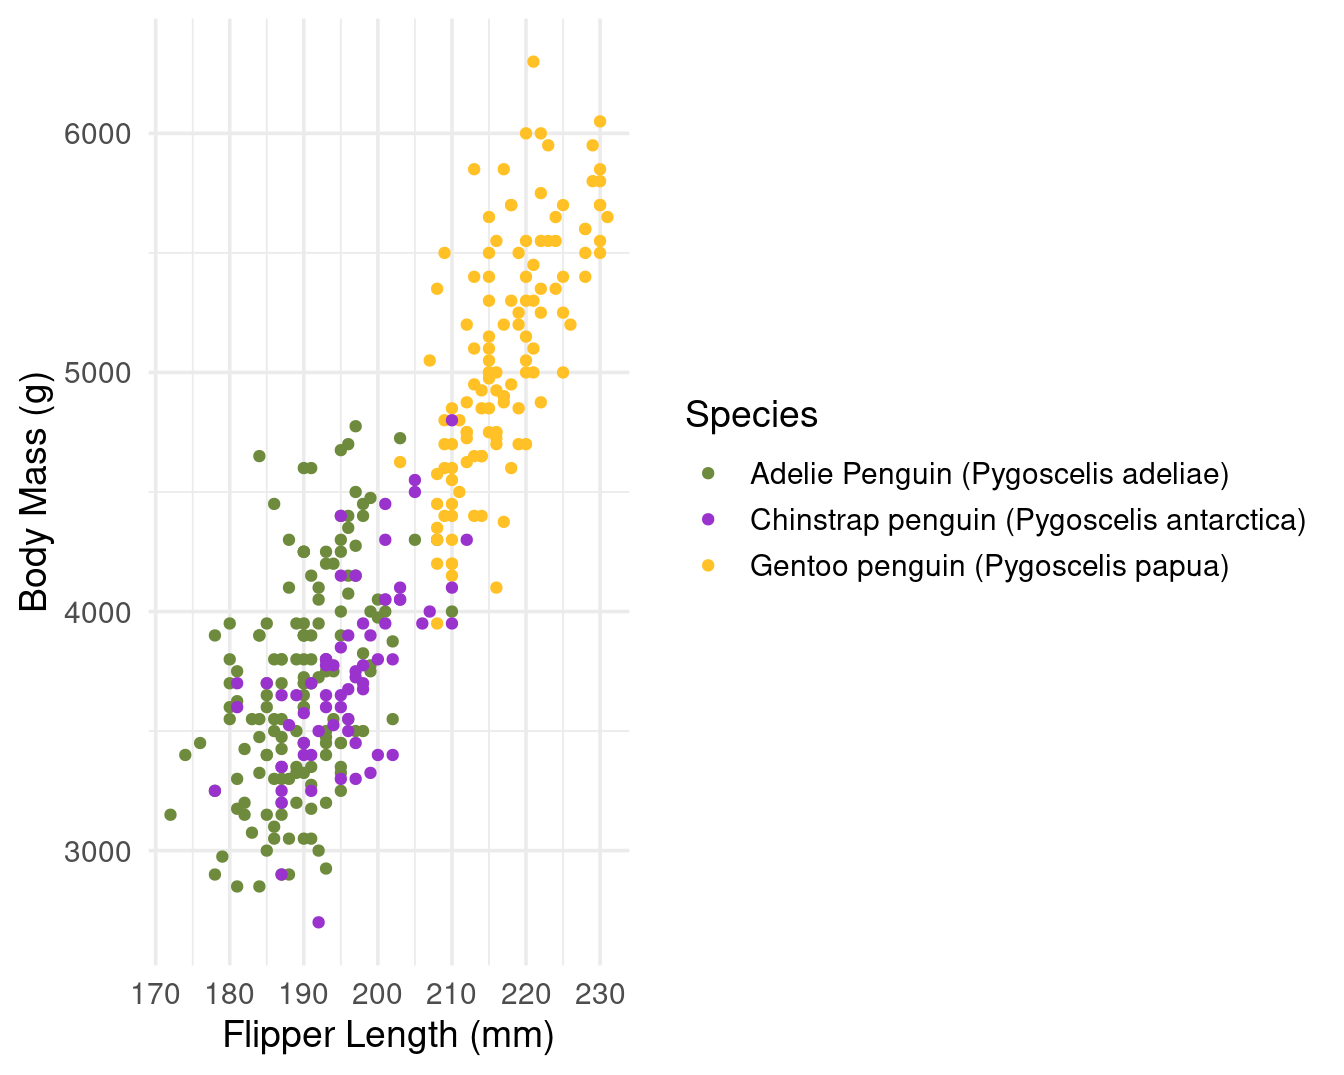
To find the result you like, you’ll need to combine sizes set in your theme and set in the chunk options. With my customised theme, the default size (7) looks good to me.

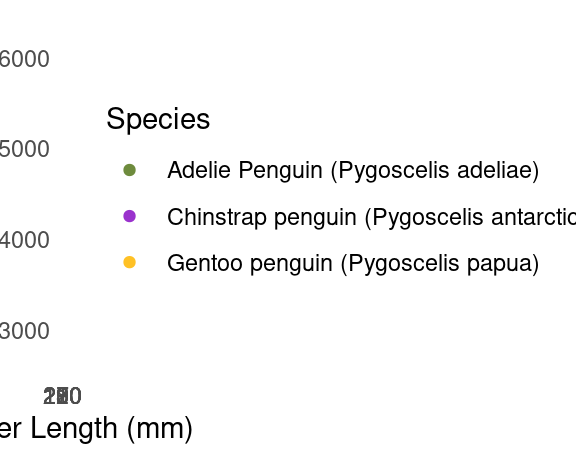
When texts axis are longer or when figures is overloaded, you can choose bigger size (8 or 9) to relatively reduce the figure elements. it’s worth noting that for the text sizes, you can also modify the base size in your theme to obtain similar figures.
Size of final figure in document
With the previous examples, you could see the relative size of the elements within the figures was changed - but the area occupied by the figures remained the same. In order to change this I need out.width or out.height
Figures made with R in a R Markdown document are exported (by default in png format) and then inserted into the final rendered document. Options out.width and out.height enable us to choose the size of the figure in the final document.
It is rare I need to re-scale height-to-width ratio after the figures were produced with R and this ratio is kept if you modify only one option therefore I only use out.width. i like to use percentage to define the size of output figures. For example hre with a size set to 50%
Static images
You can include images in your Quarto doc:
Tables
Markdown tables
| Syntax      | Description |
| ----------- | ----------- |
| Header      | Title       |
| Paragraph   | Text        |
Which will render as this
| Syntax | Description |
|---|---|
| Header | Title |
| Paragraph | Text |
gt()
The gt Iannone et al. (2024) package is all about making it simple to produce nice-looking display tables. It has a lot of customisation options.
| Species | Body Mass (g) | Flipper Length (mm) |
|---|---|---|
| Adelie Penguin (Pygoscelis adeliae) | 3700.662 | 189.9536 |
| Chinstrap penguin (Pygoscelis antarctica) | 3733.088 | 195.8235 |
| Gentoo penguin (Pygoscelis papua) | 5076.016 | 217.1870 |
Tip
You won’t be able to see these tables unless you try re-rendering your .qmd file.
Connecting scripts and reports
21.0.1 TASK: Create a separate R script for data import and quick cleaning save this and then source this into a new .qmd file.
Create a new Quarto doc.
Save this (without changes) to the same folder as your
.Rprojfile and call itlinked_report_penguins.qmd.We will now source pre-written scripts for data loading and wrangling in your R project, just use the source command to read in this script.
If you were making ggplot figures last session - you could source that script to put figures into your report
You will need to include a R chunk to print the figures - either by copying the code into a chunk, or assigning the plot to a named object in your R script and retrieving the name in your report R chunk.
Useful tips
Tip
The working directory for .qmd files is a little different to working with scripts.
With a .qmd file, the working directory is wherever the qmd file itself is saved.
For example if you have your .qmd file in a subfolder ~/outputfiles/markdown.qmd the code for read_csv(“data/data.csv”) within the markdown will look for a .csv file in a subfolder called data inside the ‘markdown’ folder and not the root project folder where the .RProj file lives.
So we have two options when using .qmd files
Don’t put the .qmd file in a subfolder and make sure it lives in the same directory as your .RProj file - that way relative filepaths are the same between R scripts and quarto files
Use the
herepackage to describe file locations
Heuristic file paths with here()
The package here Müller (2020) and its function here() (here::here()), make it easy to tell R where to find and to save your files - in essence, it builds file paths. It becomes especially useful for dealing with the alternate filepaths generated by .qmd files, but can be used for exporting/importing any scripts, functions or data.
This is how here() works within an R project:
When the
herepackage is first loaded within the R project, it places a small file called “.here” in the root folder of your R project as a “benchmark” or “anchor”In your scripts, to reference a file in the R project’s sub-folders, you use the function
here()to build the file path in relation to that anchorTo build the file path, write the names of folders beyond the root, within quotes, separated by commas, finally ending with the file name and file extension as shown below
here()file paths can be used for both importing and exporting
So when you use here() wrapped inside other functions for importing/exporting (like read_csv() or ggsave()) if you include here() you can still use the RProject location as the root directory when rendering Quarto files, even if your markdown is tidied away into a separate sub-folder.
This means your previous relative filepaths should be replaced with:
Warning
You might want start using the here() from now on to read in and export data from scripts. Make sure you are consistent in whether you use here() heuristic file paths or relative file paths across all .R and .qmd files in a project - otherwise you might encounter errors.
Hygiene tips
I recommend having three chunks at the top of any document
YAML with global options
R chunk with library calls for All packages
R chunk for reading data or sourcing scripts
Further Reading, Guides and tips
https://quarto.org/docs/reference/
https://www.apreshill.com/blog/2022-04-we-dont-talk-about-quarto/
https://www.njtierney.com/post/2022/04/11/rmd-to-qmd/
https://www.jumpingrivers.com/blog/quarto-rmarkdown-comparison/